Lost in Prediction: Why Social Media Narratives Don't Help Macroeconomic Forecasting?
Can we predict the macroeconomy by analyzing the narratives people share on social media? We dove deep into the world of Narrative Economics, using NLP models to analyze millions of viral tweets and see if they could help us predict the fluctuations of macroeconomic indicators. 🚨 Spoiler alert: it's not that easy! Join us as we explore the interesting relationship between narratives, social media, and macroeconomy, and uncover the challenges of turning narratives into treasure.
What is Narrative Economics?
Narrative Economics is the study of how popular stories and ideas (a.k.a narratives) formed about the state of the economy could have real effects in the world. In this context, a “narrative” is a belief about the state of the world that is shared by the population, regardless of the actual state of the economy. For example, a narrative might be the belief that housing prices are increasing, whereas in reality (according to economic indicators) they are stagnating.
The central idea is that the spread of viral narratives can influence individual and collective economic behavior, leading to fluctuations in markets, changes in investment patterns, and even broader economic shifts.
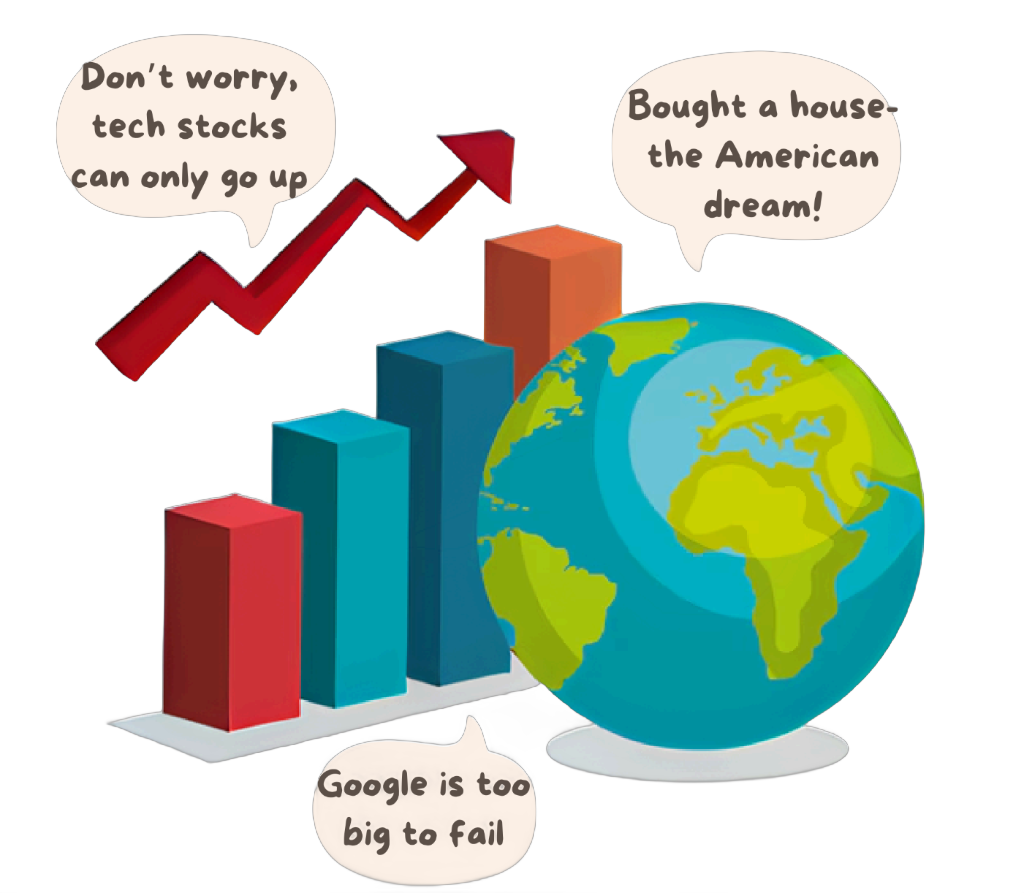
The term “Narrative Economics” is heavily attributed to Robert J. Shiller, a Nobel laureate economist and the founder of the field, who defined it as:
“Spread through the public in the form of popular stories, ideas can go viral and move markets —whether it’s the belief that tech stocks can only go up, that housing prices never fall, or that some firms are too big to fail. Whether true or false, stories like these—transmitted by word of mouth, by the news media, and increasingly by social media—drive the economy by driving our decisions about how and where to invest, how much to spend and save, and more.”
- Robert J. Shiller
The Ambiguity of the Term “Narrative”
The term “narrative” itself has different connotations in NLP compared to economics, which might lead to some confusion. 😵💫
In NLP, narrative commonly refers to the structure and elements of stories, encompassing aspects like plot, characters, setting, and theme. It involves understanding how these elements interrelate and contribute to the overall meaning and coherence of a narrative.
In Narrative Economics, as stated in the above section, narrative is a shared belief or idea that spreads through the population and potentially influences economic behavior.
Our research uses the term “narrative” in the economic sense. We’re interested in how shared beliefs about the economy can be used to predict market trends.
But, how can we capture such narratives?
The economic term is wide and it is undefined what requirements a story or idea must have in order to be considered as “narrative”. Yet, we can look at some characteristics Shiller mentions
- First, the story should be viral, publicly believed, in order to change a large enough audience to move the market.
- Second, Shiller uses some propositions while explaining the term. He states that “the economic impact of narratives may change through time” and “narrative constellations have more impact than any one narrative”.
- Last, Shiller mentions social media as a source of narratives and Google Ngram as a tool for tracking them.
Combined together, to capture a narrative, one would need a good measure of what many people are discussing, over time. Twitter (X), in this case, is an almost ideal source of information for capturing this distribution of opinions.
And how to extract the “narrative” aspect from tweets?
Aligning with Shiller’s arguments and with existing literature, the extraction might be (for example) a sentiment
Social Media Narratives 𝕏
We have collected
Both datasets were carefully curated using targeted queries with the inclusion of specific keywords, and were analyzed to ensure quality and relevant for capturing economic narratives.
Pre-Pandemic Twitter Dataset: Utilizing Twitter API
Post-2021 Twitter Dataset: We wanted to test the predictive power of our employed LLM (OpenAI’s Chat Completion API with GPT-3.5
An example tweet can be:
This is so silly. The deficit is decreasing because we’re not doing pandemic aid anymore, and federal receipts are up because of inflation. Congress, or the Biden administration, didn’t do anything to lower the deficit. https://t.co/kvlLPpsUO9
— New Liberals 🌐🇺🇦 (@CNLiberalism) May 15, 2022
This tweet from influential user @CNLiberalism exemplifies the economic narratives captured in our dataset. Posted in May 2022, it captures real-time public concerns about inflation and its impact on the deficit. This type of narrative can influence consumer behavior and market trends, which is central to our research.
Does Our Dataset Contain Narratives?
To confirm the presence of narratives within our Twitter dataset, we conducted an analysis using RELATIO
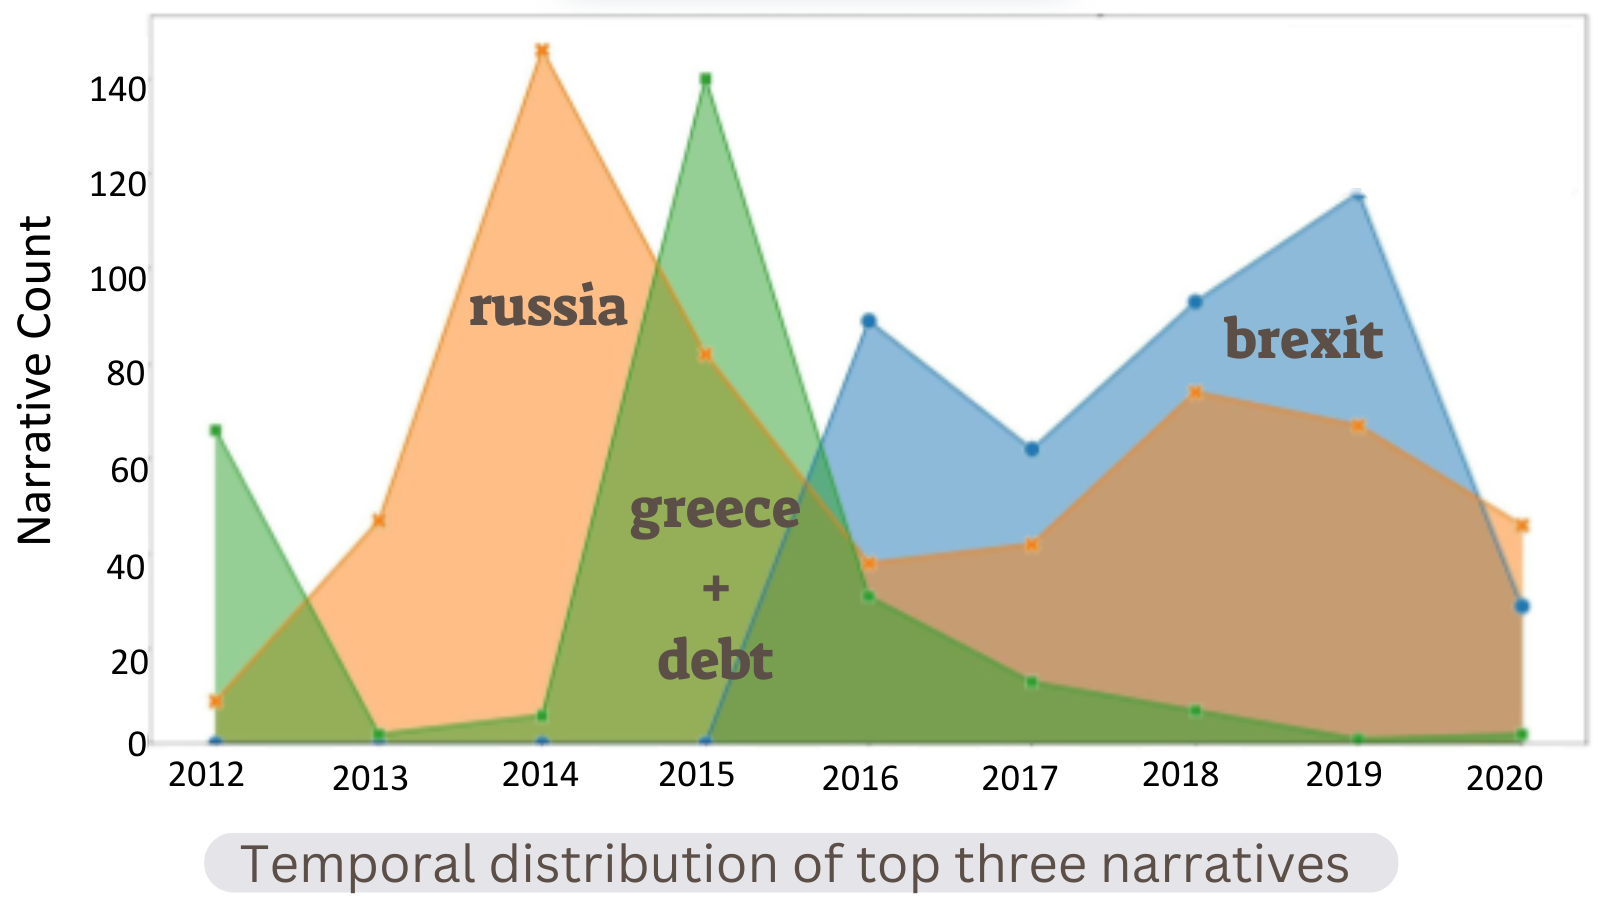
We can see the evolving nature of these narratives over time, where the distribution is aligned with real-life related events. 👍
LLMs Show Potential in Understanding Narratives
A more advanced technique to extract and analyze narratives is using LLMs. Prompting OpenAI’s Chat Completion API, GPT-3.5
Here’s a snippet of such an LLM-based narrative analysis for inputs of dates 29/08/2022 to 28/09/2022. In this time period, the Federal Reserve raised interest rates in an effort to combat inflation and the US Supreme Court ruled that the Biden administration could not extend the pause on student loan payments:
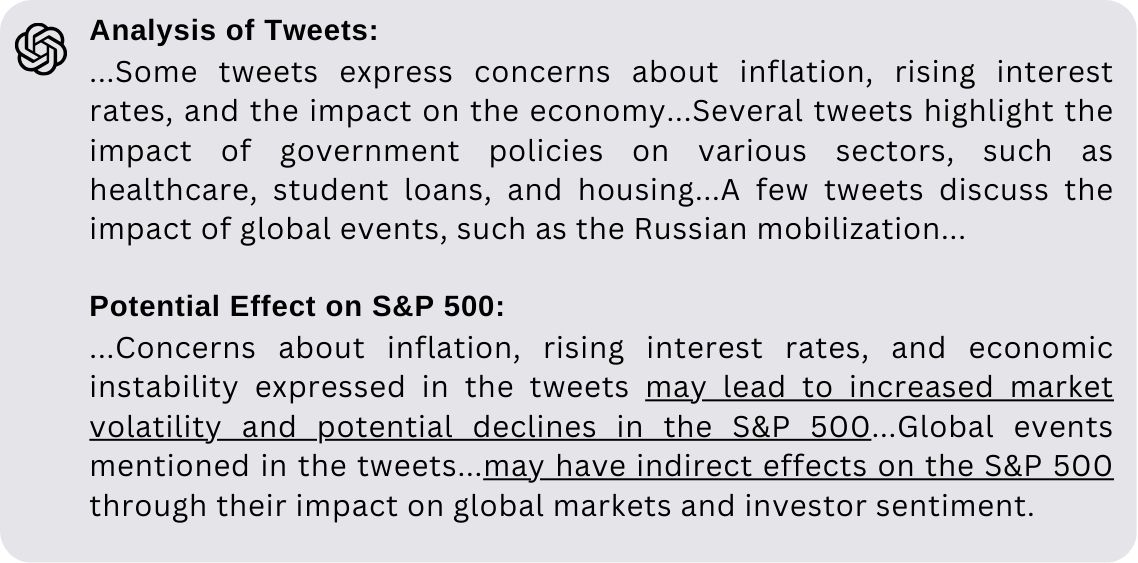
This snippet demonstrates the LLM’s ability to aggregate information, condensing and distinguishing between opinions and occurrences conveyed in the tweets. Moreover, the LLM links its insights to potential future consequences for the financial indicator, a pivotal initial move towards prediction. 👍
Narrative Economics at the Macro Level
Now that we are familiar with Narrative Economics and have established how we gathered these narratives from Twitter, let’s explore why we chose to focus on macroeconomics:
Macroceconomics studies the behavior of the economy as a whole, examining factors like inflation, unemployment, and economic growth. Microeconomics, on the other hand, is concerned with the decision-making of individuals and firms, examining indicators like a certain stock.
Why Macroeconomics?
A core concept in Narrative Economics is that narratives can drive economics fluctuations. This is especially intriguing at the macroeconomic level, as the theory suggests that widely shared stories can influence the collective decisions of millions of individuals. Additionally, existing research focuses on microeconomic indicators within the context of Narrative Economics
However, studying this at the macroeconomic level is more complex than at the microeconomic level due to the complex interplay of various factors, the need for broadly covering narratives, and the inherent difficulty in isolating causal relationships.
Our Macroeconomic Indicators
We focus on predicting three key macroeconomic indicators:
Federal Funds Rate (FFR): The interest rate at which depository institutions, such as banks, lend reserve balances overnight to meet reserve requirements. The FFR serves as a Federal Reserve monetary policy tool, is influenced by public perception of economic stability, and its fluctuations impact various sectors, making it widely monitored.
S&P 500: A stock market index measuring the performance of the 500 largest publicly traded companies in the U.S. It reflects collective investor confidence in economic growth and risk appetite and is widely regarded as a barometer of the overall health of the US stock market.
CBOE Volatility Index (VIX): Measures market expectations of future volatility based on S&P 500 options prices, often referred to as the ‘fear gauge’ as it tends to rise during market stress and fall during market stability.
These indicators are well-suited for testing the predictive power of narratives in macroeconomics due to their daily frequency, which aligns with the rapid pace of Twitter, and their sensitivity to public sentiment and behavior.
Connecting the Dots: Testing the Effectiveness of Narratives for Macroeconomic Forecasting
The previous two sections discussed the theory of Narrative Economics and our curated Twitter dataset, which holds narratives within them, and the distinction between macroeconomics and microeconomics, explaining why it is interesting to research the theory at the macroeconomic level and which macroeconomic indicators we chose.
We can now delve into the series of experiments we tested to assess the central question - can economic narratives provide valuable insights for future macroeconomic movements?
Each experiment tests the predictive power of narratives from the curated datasets, for macroeconomic prediction of one (or more) of the financial targets introduced before: FFR, S&P 500, and VIX.
We won’t be able to cover all the details of the experiments in this blog, but it is available in our paper
Experimental Setup
Prediction Tasks
We test the predictive power of narratives on three tasks commonly used in macroeconomic literature
- Next value: Predicts the target’s value at the specified horizon.
- Percentage change: Predicts the target’s percentage change between the specified horizon and the day before.
- Direction change: Classifies the target’s direction of change (increase or decrease) between the specified horizon and the day before.
Models Categories
We divide our models into 3 categories based on their input signal:
- Financial (F): Utilizes historical financial data, from the past week or month.
- Textual (T): Leverages solely textual data, either raw tweets or tweets’ analyses.
- Textual & Financial (TF): Draws upon both textual and financial data as input.
Our goal is to effectively leverage insights from both textual narratives and historical financial patterns to improve prediction accuracy. The added value of incorporating textual narratives can be demonstrated if a model that utilizes both text and financial data (TF model) outperforms a model that relies solely on financial data (F model).
Baselines
Financial baselines:
- As/Inverse-previous: Next value is the same/inverse as previous.
- Majority: Next value is the majority vote of the previous week/training data.
- Up/Down: Always predict ‘increase’/’decrease’.
Counterfactual textual baselines:
During our experiments, we encountered some intriguing results that warranted further investigation. To ensure the validity of our findings and rule out any counterfactual explanations, we introduced counterfactual textual baselines. These baselines allowed us to rigorously test whether the observed improvements were truly due to the models’ capabilities or stemmed from other factors. Unfortunately, these baselines revealed that the promising results were more elusive than we hoped.
- Random texts: Feeding the LLM with randomly generated sentences comprised of varying random words. This baseline evaluates whether the LLM actually utilizes the content of tweets.
- Shuffled tweets: Feeding the LLM with chronologically disordered tweets, isolating the impact of temporal narratives from confounding patterns or memorization. This baseline assesses the model reliance on temporal narratives.
- Synthetic ‘narratives’: Feeding the LLM with generated narrative-like sentences expressing positive or negative cues, aligned with subsequent changes in the financial target. This baseline assesses the LLM’s ability to infer relationships between aligned narratives and the following market changes.
Models
Our model selection progresses from simpler models, frequently employed in the financial literature
- Achieving positive results with simpler models provides a stronger evidence for the predictive signal of narratives.
- It allows us to build upon existing research in Narrative Economics, which is primarily rooted in finance and often utilizes relatively simple models, before exploring more advanced NLP approaches.
Financial models: These include traditional ML models (e.g., Linear Regression, SVM), DA-RNN
Textual models:
- Daily sentiment: A simple method, commonly used in the literature, is presenting each tweet with its sentiment score. Then, we average the scores of individual tweets of the same dates to receive a daily sentiment, and concatenate over a week.

- LLM’s representations of individual/joint tweets: We derive embeddings of individual or concatenated tweets using pre-trained language models (BERT
, RoBERTa , and T5 ). In the individual case, tweet embeddings are aggregated daily by averaging or concatenating embeddings of same-date tweets. In the joint case, tweets are concatenated daily to create a single daily embedding, potentially capturing their collective meaning without explicit aggregation, avoiding potential information loss.

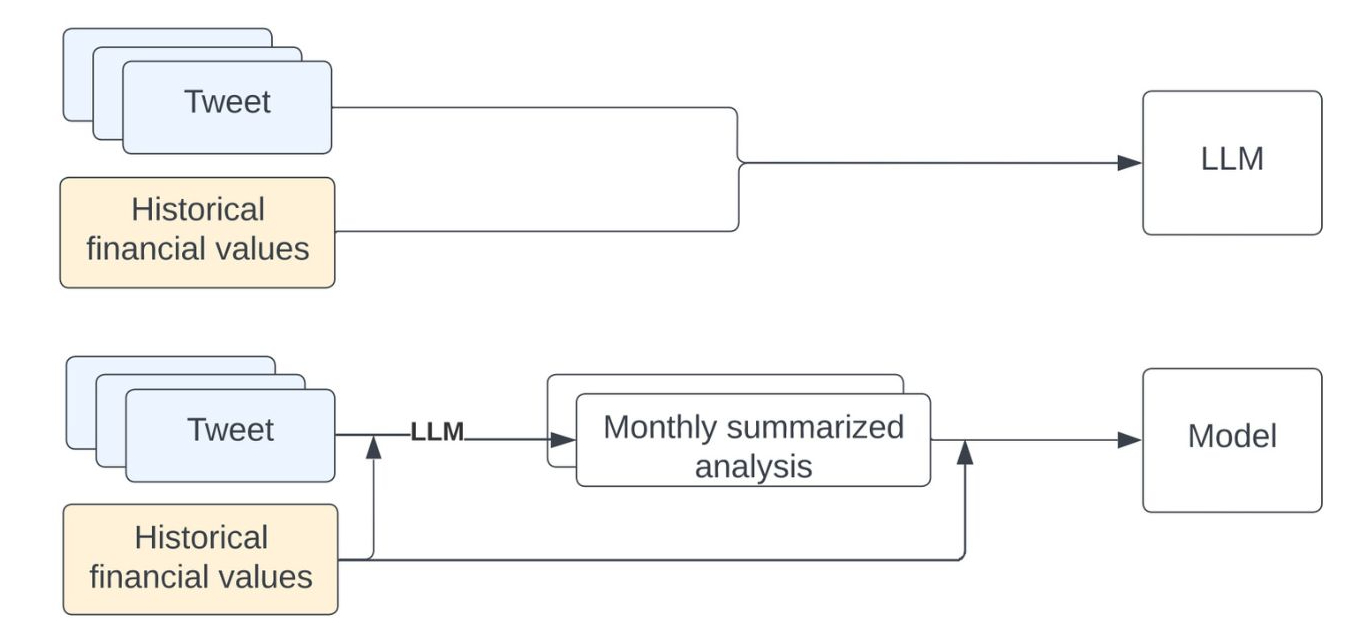
- LLM-generated analyses for prediction or as input to a subsequent prediction model: First, we feed OpenAI’s Chat Completion API, GPT-3.5
with a month of tweets and corresponding financial values of the target indicator to create monthly analyses.Then, these analyses are either used directly for prediction or as an input to a subsequent T5 model.
*since the LLM receives both tweets and financial data to enable analyzing relationships, this method applies only for a TF model type.
Fusing textual and financial models: We experiment with several strategies for combining the representations from the T and F models for unified prediction:
- Concatenation: The simplest approach is concatenating the T and F representations.
- DA-RNN
: The dual-stage attention-based RNN model predicts the current value of a time-series based on its previous values and those of exogenous series. We feed historical financial representations (F) as the time series and textual representations (T) as the exogenous series. -
Prompt-based fusion: LLM-based analysis of given tweets and historical financial values of the target indicator are fed together with raw historical values of the target to a T5 model as separate segments.
Given a TF model, we can derive a T or F model by omitting or zeroing either F or T component, respectively.
The Challenges in Improving Models with Narratives
TL;DR:
- Models incorporating narratives (TF) show limited improvement over those using solely financial data (F).
- Gains were inconsistent, marginal and statistically insignificant. We regard it as negative results.
Sentiment-Based Prediction
We fed classic ML models with daily sentiments for FFR ‘next value’ and ‘direction change’ prediction (as separate tasks).
The results:
- Direction change: 💡 Adding sentiment data didn’t help, as both models with financial input (F & TF) achieved similar accuracy (0.939 vs. 0.936). Additionally, text-only models (T) underperformed (0.89), achieving a comparable accuracy to the F baselines (0.89 vs. 0.81).
| Type | Model | Accuracy |
|---|---|---|
| F baseline | As-previous | 0.812 |
| F | Random Forest Numeric | 0.936 |
| TF | Random Forest Numeric | 0.939 |
| T | Logistic Regression | 0.885 |
| SVM | 0.885 |
- Next value: 💡 None of the models, with or without sentiment or financial data, outperformed the non-learned ‘train-mean’ baseline (15.4, 15.6).
| Type | Model | MSE |
|---|---|---|
| F baseline | Train-mean | 15.661 |
| F | SVM | 15.416 |
| TF | SVM | 15.416 |
| T | SVM | 15.36 |
What can we learn? 🤔 Sentiment analysis lacks the nuance necessary for accurate financial prediction, and traditional ML models have limitations in capturing complex market dynamics. ➡️ We need an improved text representations and more advanced prediction models.
Embeddings for Time-Series Prediction
Here we turn to embedding-representations (as explained in the Experimental Setup) and to DA-RNN
We extensively evaluated various model configurations, target indicators (FFR and VIX), tasks (‘next value’, ‘percentage change’, ‘direction change’ and the last two together), prediction horizons (next-day, next-week), LLM architectures (see Experimental Setup), aggregation methods, and the daily number of tweets given as input. Additionally, we assessed the models’ reliance on temporal context and relevant narratives using the counterfactual textual baselines.
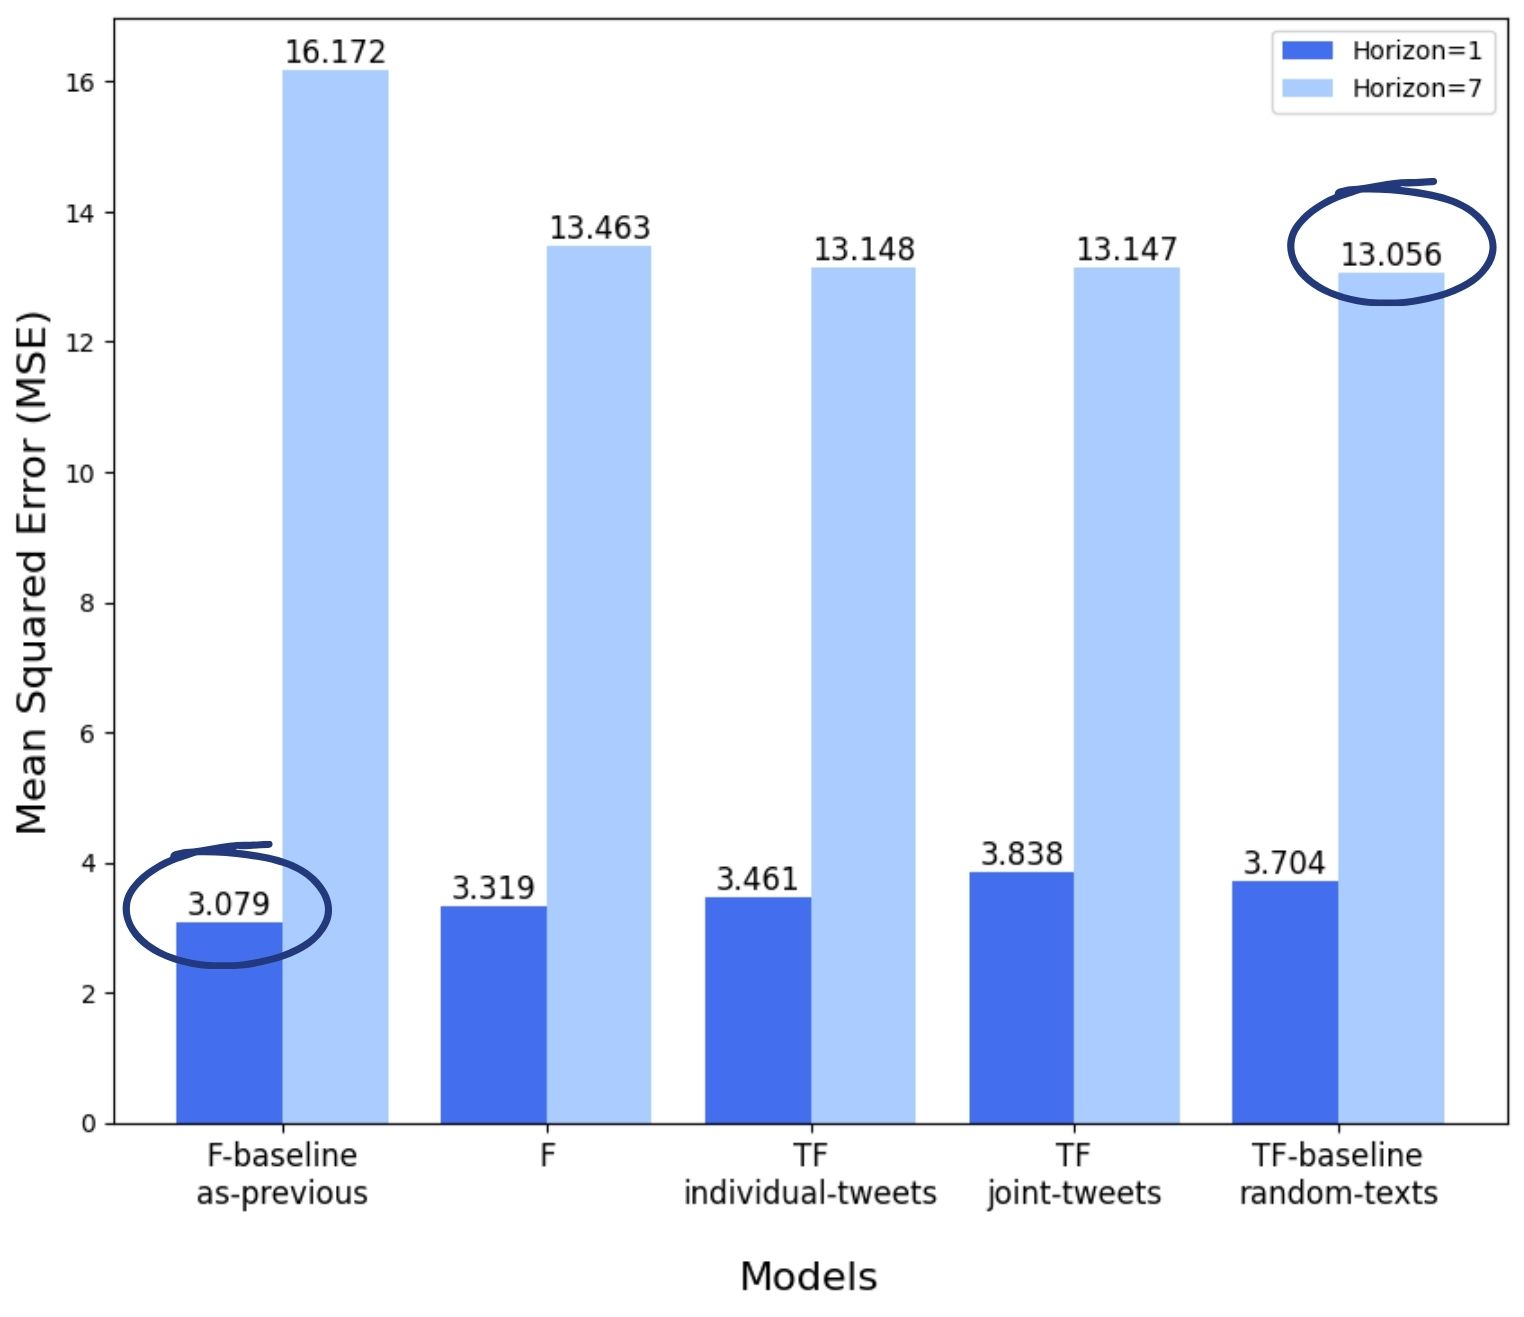
To keep it short, we present results only for predicting the VIX ‘next value’ of the next-day and next-week (as separate tasks). Additional experiments showed a recurring pattern to the presented results.
The results:
-
Next-day prediction: 💡 The non-learned ‘as-previous’ F baseline outperforms all other models (3.079 MSE). This suggests that the input data may not be beneficial for such a short-term prediction.
-
Next-week prediction: Initially both TF models (13.148, 13.147) appeared to outperform the F model (13.463) and F baseline (16.172), implying a potential influence of the textual content.
💡 However, the ‘random texts’ TF baseline (13.056), which replaced actual tweets with randomly generated text, outperformed all other models, indicating the observed improvement was not driven by meaningful textual content.
We hypothesize that the presence of text improves performance, even when random, due to spurious correlations or random noise aiding generalization, similar to regularization techniques. A contributing factor may be the difficulty of effectively capturing and representing aggregated tweet information for financial prediction, as well as the inherent challenges in predicting future values of a volatile financial indicator, characterized by frequent random movements and fluctuations, using its historical values.
What can we learn? 🤔 Our models struggled to leverage tweets for the prediction, indicating that implicitly capturing and aggregating latent narratives within LLMs remains a challenge.
Predicting Using LLM Analyses
Can LLMs generate an accurate prediction? We first tried to directly predict the financial indicator (average weekly VIX or S&P 500) as a generative response of the web chat version of GPT
Repurposing the LLM analyses for a subsequent prediction model: The previous experiment revealed the LLM’s ability to generate insightful analyses of tweets and financial data. To leverage this capability, we utilize these analyses as inputs for a dedicated prediction model to predict the S&P 500 ‘direction change’.
This approach addresses limitations of the two previous experiments by:
- Instead of relying on the embedding-based approach, which struggled to aggregate diverse narratives, we leverage the LLM’s ability to produce concise analyses.
- Instead of directly using the LLM for prediction, which exhibited inconsistencies, we utilize a separate fine-tuned model for downstream prediction.
The results:
| Type | Model | Accuracy | F1-Score |
|---|---|---|---|
| Train-majority | 0.424 | 0.0 | |
| Week-majority | 0.484 | 0.598 | |
| F-baselines | As-previous | 0.484 | 0.552 |
| Inverse-previous | 0.517 | 0.511 | |
| Up-predictor | 0.576 | 0.731 | |
| Down-predictor | 0.424 | 0.0 | |
| F | T5 Base | 0.604 | 0.723 |
| T5 Large | 0.593 | 0.727 | |
| TF | T5 Base | 0.626 | 0.738 |
| T5 Large | 0.627 | 0.742 | |
| T | T5 Large | 0.587 | 0.726 |
| T-baseline | Synthetic narratives | 0.489 | 0.254 |
Did it work? Unfortunately, not really. 💡 Results show that there is no significant difference between the best TF and F models, with a performance gap of ~2% on the limited test set of ~90 samples.
What can we learn? 🤔 While LLMs can analyze narratives, the TF model struggled to effectively leverage this analysis for improved prediction.
What Can We Take Away?
Despite the presence of narratives in our curated datasets and the development of NLP tools for narrative extraction, evaluating their impact on macroeconomic prediction remains challenging. Our models incorporating narrative data showed limited improvement over those using only financial data, failing to consistently outperform baselines or financial models. Any observed improvements were marginal and statistically insignificant and we regard it as a negative result.
The missing link between the successful narrative extraction demonstrated by the LLM’s analyses and the limited improvement in macroeconomic prediction raises a question about the extent to which narratives alone can truly drive and forecast economic fluctuations, at least at the macroeconomic level.
This study serves as a foundation for further exploration, highlighting the need for new macroeconomic models or tasks that can effectively assess the influence of extracted narratives on the economy.
Our Research Limits and Challenges
Like any research, this project has potential limitations and faced several interesting challenges:
First, we focused on “nowcasting” – predicting indicators right now or very soon. Economic markets are inherently complex and involve randomness, making accurate short-term prediction a significant challenge. The Efficient Market Hypothesis suggests that the predictive power of nowcasting is limited as asset prices react instantly to public information. However, Narrative Economics theory proposes that narratives affect people’s decisions, potentially giving us an edge in predicting economic fluctuations
We only looked at a few specific economic variables (FFR, S&P 500, and VIX), influenced and shifted by diverse, external, and unobserved sources. Looking at different targets, or trying other tasks like detecting market anomalies or predicting profit, might have shown stronger evidence of the impact of narratives on the economy.
The challenge of timing: When does a narrative actually start to impact the market, and for how long? Does it take hours, days, weeks? Although comprehensive, our experiments only examined a limited set of time lags and prediction horizons.
What IS a Narrative?: While our datasets were carefully curated to capture potential narratives, definitively identifying them is challenging, especially when trying to aggregate multiple narratives for a holistic economic picture. The definition of “narrative” itself is broad and subjective, often only becoming clear in retrospect. This, combined with the inherent noise, biases, and misinformation common on social media, makes extracting clear, reliable narratives a complex task.
Our worldview: Our analysis relies on English-language data from Twitter and focused on US-centric macroeconomic indicators. Narratives and economies work differently around the world and on different social media platforms or other outlets. This is definitely an area for future expansion.
Lastly, we are limited to publicly accessible LLMs with a known cutoff date to ensure the models couldn’t “cheat” by accessing future knowledge. However, utilizing different models might lead to better results.
A quick word on ethics: This research involves technology aimed at predicting human and economic behavior. It’s vital to state clearly that this kind of tech could be misused in harmful or unfair ways (e.g., for market manipulation or unfair practices). We strongly believe it needs to be developed and used with caution and constant awareness of its ethical implications.
This blogpost extends the technical experiments presented in our paper